Anatomy of a usability test
Usability testing (or user testing) is an evaluative user research method. It’s specifically helpful when understanding if the UX design (user experience) “works” – can a human comprehend the information and complete goal-oriented tasks within acceptable limits? Usability testing is a great way to de-risk the launch of a product. It identifies potential hurdles or drop-off points with a new product flow or feature before it becomes available to your customer base.
Usability testing is:
Assesses whether a user can navigate a product/flow/feature for its intended function
Assesses which areas of a product/flow/feature users have difficulty with
Measures users’ attitudes towards a task (satisfaction, comfort, ease of use)
Provides direction on what areas of the product/flow/feature need attention before shipping
Usability testing is not:
Ethnographic in nature. It will not help us understand our users’ backgrounds, beliefs, needs, or behaviors.
Generative. It will not help us understand our users’ pains or gaps in an experience.
Statistically significant quantitative data (usually)
Used to assess addressable market
When to conduct usability testing
When you are looking to evaluate the usability and comprehension of a new design concept/feature
When you have low or hi-fi wires of a screen design and/or short user flow
Ideally, after you’ve completed generative, exploratory, or concept validation research studies
Before you launch the product/feature
A framework for designing great tests
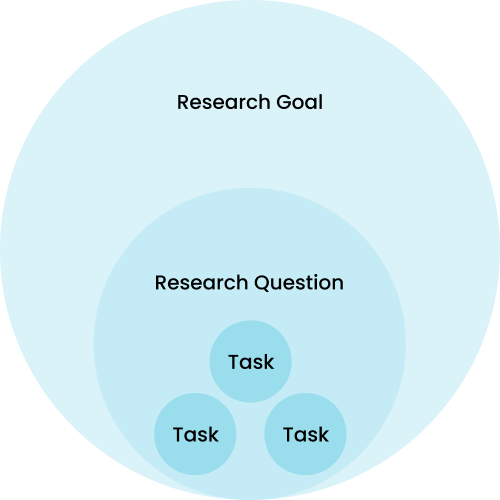
To get the most out of your user test, it’s best to be very clear on what it is you want to learn. The below framework is helpful for narrowing in on your goals and tasks and designing a valuable study.
Research goal: What are you trying to learn? eg. “Understand the usability of the shopping experience.”
Research question: Usually framed with a user behavior or experience goal in mind. These questions should ladder up to the research goal and help you curate your task types. eg. “Are the filter/sort features discoverable and usable?”
Task: An actionable request that you ask of your participants to capture insights that will help you answer the research question. eg. “Imagine you are looking to buy a pair of sneakers. Find all sneakers that are available in size 10.”
There are two types of tasks:
Open-ended - Open-ended tasks and questions allow the participant to respond without any constraints. They are particularly helpful in gaining deeper insights from your participants, for example, the reasons behind a response or attitude, or general feedback.
Closed - Closed tasks and questions provide a finite set of options for the participants to select from. These are generally quick and easy to analyze.
Tasks
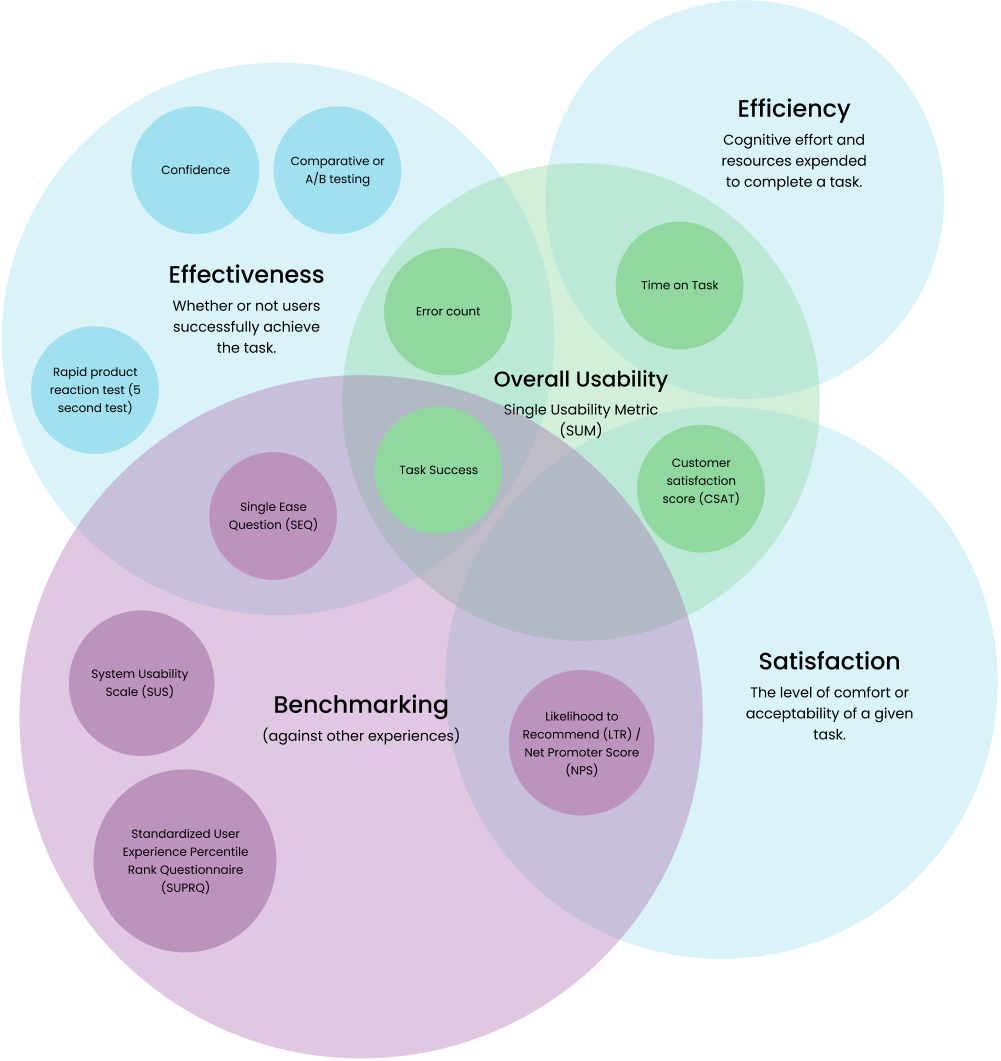
The majority of tasks can be broken down into 3 main categories:
Effectiveness - Whether or not users successfully achieve the task.
Efficiency - Cognitive effort and resources expended to complete a task.
Satisfaction - The level of comfort or acceptability of a given task.
1. Effectiveness
The following data types help us understand whether or not a user can accurately complete a task that allows them to achieve the desired goal.
Task Success: This simple metric pass/fail measure, that tells you if a user could complete the given goal-oriented task.
Error Count: This is the number of errors a user committed while trying to complete a goal-oriented task. It can be calculated with miss-clicks, rage clicks, or an indirect path that may yield errors.
Single Ease Question (SEQ): This question measures (on a seven-point scale) the participant's perceived ease of completing the goal-oriented task. It’s used as a predictor of task completion rates and times. Ask the SEQ after each completed (or failed) task. A sample of at least 10 should be used to yield meaningful results.
Confidence: Confidence asks users to rate (on a seven-point scale) how confident they were that they completed the task successfully.
Comparative or A/B testing: This is a method of comparing two versions of a design solution to determine which one performs better. Remember to alternate between showing A vs B first to avoid bias.
Behavior: Observing behavior (when running moderated studies) can provide valuable qualitative data that can help you understand “why” participants might be struggling with a given task.
5 Second Test or Rapid product reaction test: This is a method where participants are shown a design for 5 seconds and then asked to respond to a task. It can be used to assess messaging (recall and comprehension) and visual communication of a given screen.
2. Efficiency
The amount of cognitive effort and time it takes for a user to complete tasks.
Time on Task: This metric measures how long it takes participants to complete or fail a given task. Longer task times are generally an indicator of usability problems. There are 3 ways to report this data:
Average Task Completion Time: Include only users who completed a task successfully. This is the most common way to report.
Mean Time to Failure: The average time users are spending on a task before they give up or complete the task incorrectly.
Average Time on Task: The total duration users are spending on your task.
Subjective Mental Effort Question (SMEQ): The SMEQ allows the users to rate the perceived mental effort to complete a task. It consists of a single scale (rated from 0-150) with nine labels from “Not at all hard to do” to “Tremendously hard to do”. This is slightly more sensitive than the SEQ. A sample of at least 10 should be used to yield meaningful results. Learn more.
3. Satisfaction
Satisfaction measures how well a product or service experience meets customer expectations. Understanding your customers’ task sentiment can help you prioritize the importance or urgency of design revisions. It can also be used as a prediction of customer loyalty.
Attribute or Transaction Satisfaction: This task asks the participant to rate (on a 7-point scale) their satisfaction with a specific flow/feature. It can be used to diagnose issues related to features, quality, ease of use, and price. To understand what’s driving these ratings, offer a space for customers to add a comment about their attitude.
Likelihood to Recommend (LTR) / Net Promoter Score (NPS): The Net Promoter Score is an index ranging from -100 to 100 that measures the willingness of customers to recommend a company's products or services to others. It gauges the customer's overall satisfaction by asking them to respond to an 11-point scale (0 - 10) and is an indicator of a customer's loyalty to the brand.
Calculating overall usability
Single Usability Metric (SUM): This metric is a compilation of 4 key metrics: task completion rates, task time, satisfaction, and error counts, and is used to represent the usability of a given task. A SUM calculator will help you compute these metrics. Download the SUM Calculator from MeasuringU.
Benchmarking (against other websites)
Some of the above metrics have industry averages and can be used to benchmark your digital experience. Below are benchmarking metrics, companies should aim for, or try to exceed (source MeasuringU):
Task Success/Completion rate average: 78%
SEQ average: 5.5
NPS: average in your industry or, your company over time
Alternatively, there are standardized surveys that can be used to benchmark overall usability.
System Usability Scale (SUS): The SUS has become an industry standard and is derived from a ten-item questionnaire (graded on a 5 pt likert scale). It can be conducted with a min of 5 participants. It measures the perceived usability of an experience. Learn more.
SUS average: 68
Standardized User Experience Percentile Rank Questionnaire (SUPR-Q): This 8-item questionnaire is ideal for benchmarking a product's user experience. It allows participants to rate the overall quality of a product's user experience based on four factors: usability, trust/credibility, appearance, and loyalty. For this reason, SUPR-Q can be used to calculate sub-scores for these categories. Learn more.
SUPR-Q average: 50%
Additional user testing techniques
References
https://uxpsychology.substack.com/
https://www.retently.com/blog/